Follow-Up: Council Rock Looking into Math Program

As a follow-up about the issues I raised in a recent post comparing PSSA scores over the years and about which I made public comment at last Thursday’s Board Meeting, the District is in the process of taking a look at Math.  I am told the two high school principals are collecting data, and that the District plans to share information with the Board through the Academic Standards Committee (whose meetings are public but not televised).

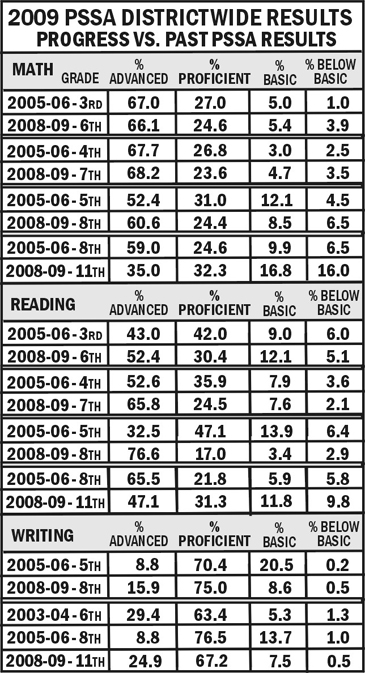
As a reminder, I took PSSA results from three years ago and compared it to results this year for three grade-levels higher (thus, comparing the same general student groups’ performances).  In Reading the results over the years for proficiency were generally good, as well as in Writing.  The numbers in Math, however, revealed a trend that called for some examination.  At every grade level, there was an increase in the number of students performing below basic. In three of the four levels where comparison could be done, the percentage of students who scored proficient or advanced had dropped.

Another issue of concern was the drop-off from 8th grade to 11th grade performance scores in Reading and Math.  Although there may be anecdotal stories of high school students not giving the PSSAs the same level of exertion as SATs since PSSAs don’t affect marks or graduation, the results in Writing did not suggest the same thing.  So did 11th graders try harder in Writing while not as much for the other two subject areas, or are there other causative factors?

It is important that these numbers be used to check for trends and issues now, because the system will be undergoing change over the next few years.  As I posted a few days ago, the PSSA-M tests will begin to be given to students with IEPs in Math this year and in Reading next year.  This will change the dynamics of results so the same comparisons won’t be possible.  It won’t mean that a problem doesn’t exist, only that PSSA results across the years won’t have the same data bases so no valid comparison will evidence those potential issues.  Furthermore, the State is moving toward introducing Keystone exams in high schools in the next few years, meaning another change in the ability to compare students’ progress.

This will bear watching to see what determinations are made regarding curriculum and/or instruction as they relate to lagging test results.

New PSSA-M Tests in Lieu of PSSAs for Special Education Students

Today’s Courier Times has an article by Joan Hellyer (who does a very good job reporting on education issues) about a change by the Pennsylvania Department of Education on testing of Special Education students.  There will be new tests in lieu of PSSAs and also a change in how their results will get factored into the schools’ Adequate Yearly Progress (AYP) results. To read the article, click this link.

The new tests, called the Pennsylvania System of School Assessment-Modified (PSSA-M), “will be less cognitively complex and shorter” than the standard PSSAs, state officials are quoted in the article. Results from PSSA Math and Reading tests are used by the State to determine whether schools achieved Adequate Yearly Progress (AYP), as required by the Federal Government’s No Child Left Behind Act.

Here is a link to the Pennsylvania Department of Education regarding the PSSA-M exams and revised assessment system.

Up till now, Special Education students (except those severely disabled) took the same PSSA exams as the rest of the student population. However, many school officials have maintained that Special Education students often don’t learn at the same pace as mainstream students, and have held that their scores shouldn’t be used to determine a school’s AYP results.

As noted in an earlier post, both Council Rock High School North and Council Rock High School South were placed on warning status for this year. That was attributed to Special Education students there not demonstrating sufficient proficiency as a whole in at least one of the PSSA exams.

The PSSA-M Math test will be used beginning in 2009-10, and the modified Reading test will be used starting in 2010-11. The eligibility to take the PSSA-M rather than the standard PSSA will be determined by the student’s Individual Education Program (IEP).

Joan’s article indicates that this new system will change how Special Education students’ test results count toward AYP measurement. There will be no limit on the number of Special Education students who can take the PSSA-M exams — but only 2 percent of the satisfactory marks from these tests will count toward a school’s proficiency rating for AYP status. The remaining results will get factored in together with the scores of mainstream students. who scored in the below basic range, officials said. Below basic suggests a student is performing below his or her grade level.

Mark Klein is quoted in the Courier Times:

At this point, it’s more of a gesture than a solution. I don’t know if it goes far enough and takes into consideration the significant difficulties the special education students face.

But at least it’s a change in a direction that appears to recognize some of the school officials’ concerns.  I’m not sure what local officials would say is a solution. Some means of measured accountability must be provided to monitor how schools are doing for all their students.

Guest Editorial in Courier Times about the Need for Merit Pay and for Ending Tenure

Today’s Courier Times contains an interesting guest editorial from Simon Campbell in Pennsbury discussing the need to introduce merit pay and to end the current system of tenure.

As part of the write-up, the writer cites statements made by Bob Chanin, retiring general counsel of the NEA (National Education Association), the teachers’ union.  The comments about why he considers NEA such strong advocates present a view on where that union’s interests lie.

Despite what some among us would like to believe, it is not because of our creative ideas. It is not because of the merit of our positions. It is not because we care about children. And it is not because we have a vision of a great public school for every child. NEA and its affiliates are effective advocates because we have power. And we have power because there are more than 3.2 million people who are willing to pay us hundreds of millions of dollars in dues each year because they believe that we are the unions that can most effectively represent them, the unions that can protect their rights and advance their interests as education employees.

(The above quote can be found on a YouTube video at this link, at the 21:38 mark.)

It is a little disconcerting that this official from the NEA ranks power as more important than caring about children, or having a great public school for every child.

I believe (and I think that most people would believe) that the overwhelming majority of teachers sincerely care for their students’ education. However, the powers-that-be have created a system which sometimes can work against those interests. Systems such as tenure make it virtually impossible to remove educators whose performance is not properly supporting his/her students. Salary increases ties simply to longevity instead of measured performance also impedes in some ways a strong incentive to improvement. Having mandatory union membership prevents teachers from having a means to choose a different course.

In light of this, I think it’s important to watch what transpires at Hatboro-Horsham, where the Board and Administration are trying to introduce some rudimentary form of merit pay into the new teachers’ contract.  I think this could foster an approach throughout our region where teachers become more accountable in terms of measured results. And accountability from public employees (at any level) is something the public should have a right to expect.

If you are interested in reading the Guest Editorial, you may find it at this link.

Council Rock’s PSSA Results — A Look at Student Progress Over the Years — Issues in Math and High School?

As I wrote on the blog yesterday, 2009 PSSA results are in.  And while standardized tests aren’t the be-all-and-end-all, they do provide one measure of performance.  I mentioned that one hazard when looking at results would be to compare how any given grade level did this year compared to the same grade level last year.  After all, the test results for a grade level would be for an entirely different group of students (i.e. this year’s eighth graders vs. last year’s eighth graders).

But there can be a cross-year comparison to see how the same group of students is doing as they progress through the school system.  That would take test results from a prior year for a group of students and compare it to the grade level at which those students took tests this year.  This would show to some extent how that group of students is achieving.

A comparison of scores this way reveals some good results in Council Rock, particularly in Reading and Writing.  However, an area of concern exists as more students at every level appear to drop below basic in Mathematics from where they scored three years prior.  Another area of concern is the poorer results for students at the 11th grade level than they’d been scoring on tests when these students were in 8th grade.  Some drop-off might be attributable to some students “blowing off the tests” since it doesn’t impact their college plans the way SATs do, but if that were the sole reason then one would wonder why the same large drop-off didn’t happen in the Writing (as compared to Math and Reading). So the question remains as to why there is such a large drop off in these students’ performance from 8th grade to 11th grade.

Here is a chart showing a comparison in the areas of Mathematics, Reading and Writing by each set of students’ grade levels from three years ago to the current results.  Science is not included because 2007-08 was the first year for which those results were available, so a three-year span is not yet available.

2009 pssa compar

While there are variables (some students leave and new ones come into the District), the predominant number of students progress through the system at the same time.  Rather than comparing scores from last year to this, the chart above compares scores from three years ago to this year.  The reason for that is twofold: first, it shows an amount of progress (or lack) over a span of years rather than just from one year to the next, and secondly, because the test is not given for 9th or 10th graders, 11th grade results can only be compared to 8th grade numbers three years prior.

Note: Because scores for Writing were available from 6th grade tests in 2003-04, those numbers could be compared at three grade levels for last spring’s 11th graders. (Earlier comparisons of Reading and Math for 2008-09 11th graders could not be made because 2002-03 test scores at 5th grade levels were scaled as a total mark, not broken down by the current ranking method).

Based on these results, the question of some students falling further behind in Mathematics needs to be addressed, as well as an examination of the cause for 11th grade score drop-off in Reading and Mathematics and what can be done to ameliorate that.

2009 PSSA and AYP Results: Some Good News, Some Concerns

The results are now in for Districts and Schools for the PSSA tests taken last Spring. These contain a ton of data and provide one way of looking at progress and problems.  You can see the data at this link to the Pennsylvania Department of Education (along with links there to prior year data).

When I was participating in planning sessions for Council Rock’s Six-Year Strategic Plan and brought up PSSA matters, several of the teachers and administrators contended to me that PSSA results aren’t a truly valid measure of a school’s performance. I let them know that I could understand flaws with a Statewide test being used as a single judgment point — but I said that simply saying it was not a valid measure did not mean it should be rejected unless they came up with a more valid measure.  After all, taxpayers (who pay the bills) and parents (whose kids are entrusted to the schools) have a right to expect some measurable accountability.  Simply telling us we have great schools isn’t enough.

I told the District officials and employees who were there that until they come up with a more valid way to objectively measure schools’ performances against real criteria, the public had no option but to continue to rely on PSSAs.

We have yet to see any other system of measurement of student achievement and teacher performance proposed by Council Rock to back up its performance compared to other schools in the County, State and Country.  So for now, the PSSA data continues to be one set of objective numbers that give some means of comparison.

So how did Council Rock do?  As noted in a Courier Times article today, the District as a whole met the Adequate Yearly Progress ratings under the No Child Left Behind rules.  However, both Council Rock High School North and Council Rock High School South were put in Warning status after their special education students didn’t demonstrate proficiency in at least one of the exams.

The District has met AYP progress as a whole since 2003-04 (they were on Warning status for 2002-03, the first year of the rating system).  Both High Schools had met AYP in 2007-08 before falling to Warning this year.  North had previously been under Warning status twice, and South had been given that rating three prior times (see chart below).

Superintendent Mark Klein was quoted in another article (on reactions to results), saying:

Council Rock continues to be proud of the achievement of our students. We will continue to look at individual student data in all schools and in all programs to ensure that our students are progressing against all appropriate academic measures.

There are a ton of numbers breaking down results in each District by class, by school, by subgroups (gender, race, economically disadvantaged, IEP etc.).  I think comparing how a grade level compares to a previous year at that same grade level (i.e. how this year’s 8th grade results compare to last year’s 8th grade results) can be misleading because the group of students who achieved those results is different.  Rather, I think it might be more useful to measure what has happened to the same groups of students over the years.  By that I mean comparing what the fifth graders did in 2005-06 compared to their results as eighth graders in 2008-09.  At least then we are seeing whether that group of children is making progress or falling behind (as measured by the tests).

This is a lot of information and rather than fit it all in one post which would go on for ages, I will break that kind of comparative data into charts in a separate post.

For now, here are charts showing the AYP ratings for the seven years the program has been in effect, as well as the 2009 Districtwide results for all students for tests for Mathematics and Reading, for Writing, and for Science.

2009-03 AYP

2009 pssa grade

Just using a first look at the 2009 results, I would think two areas of concern might arise: the drop-off in Science at each level the test is given (remembering that these are different groups of students), and the drop-off at the 11th grade level in mathematics and reading scores.  This may raise a question as to whether it is indicative of lower performance, or whether it may reflect less rigor applied by students in 11th grade taking the test.

The AYP warnings for the High Schools are an issue of concern by their nature, even if the issue is confined to one subgroup of students.

Future posts on PSSA results will delve a bit more into comparing progress among the same groups of students over the years.

Until there is some other system of rating progress and achievement at our schools, these numbers bear watching and attention.